System Design: Uber Architecture Deep Dive
How Uber matches millions of riders with drivers in real-time. Covers geospatial indexing with H3, surge pricing, ETA prediction, and their migration from Python to Go.
What you'll learn
- ✓How Uber matches riders with nearby drivers in under 5 seconds
- ✓How the H3 hexagonal grid system enables efficient geospatial queries
- ✓How surge pricing calculates real-time supply and demand
- ✓How ETA prediction works with historical and live traffic data
- ✓How Uber migrated from a Python monolith to Go microservices
Prerequisites
- •Understanding of distributed systems. See [CAP Theorem](/blog/system-design-cap-theorem).
- •Familiarity with real-time data processing concepts.
Uber processes over 23 million rides per day across 10,000+ cities. Every ride involves a real-time matching problem: find the best available driver near the rider, estimate arrival time, calculate a price, and route the driver — all within seconds. The system behind this handles over 1 million location updates per second from drivers and processes decisions that must be both fast and geographically accurate.
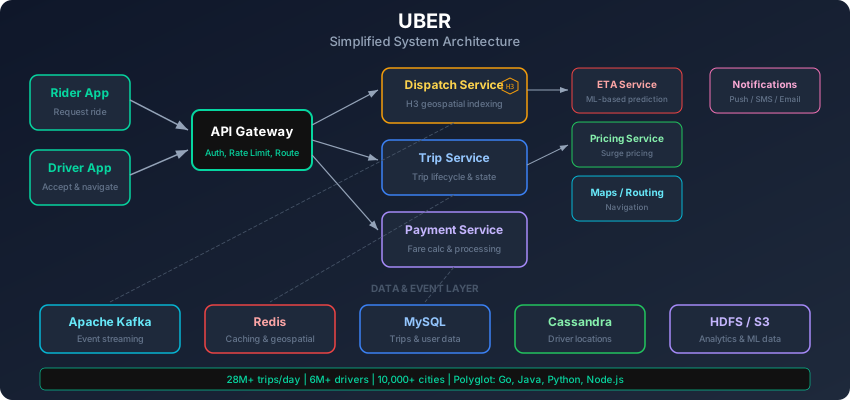
The Evolution: Monolith to Microservices
Uber started in 2010 with a straightforward Python monolith backed by PostgreSQL. The entire application — dispatch, billing, rider management, driver management — lived in a single codebase. By 2014, with rapid expansion into hundreds of cities, the monolith became unsustainable. A single bad deployment could take down the entire platform globally.
The migration happened in phases. First, they extracted the dispatch system — the most latency-sensitive component. Then billing, user management, and trip management each became separate services. By 2017, Uber had over 2000 microservices.
Think of the original system like a single switchboard operator handling every phone call in a city. As the city grew, one person could not keep up. Uber replaced that operator with a network of specialized agents: one group handles matching, another handles payments, another handles routing. Each group can scale independently.
Why Go
Uber adopted Go as its primary language for backend services around 2015. The reasons were specific:
- Concurrency model — goroutines are lightweight (a few KB of stack each), so a single server can handle hundreds of thousands of concurrent connections. Critical for tracking millions of drivers.
- Compilation speed — Go compiles in seconds, not minutes. With thousands of services deploying multiple times per day, this matters.
- Performance — Go is 20-40x faster than Python for CPU-bound work, with predictable garbage collection pauses.
- Simplicity — Go’s limited feature set makes code reviews faster across large teams.
The dispatch service, rewritten from Python to Go, saw latency drop from hundreds of milliseconds to single-digit milliseconds for the core matching logic.
The Dispatch System: Real-Time Matching
The dispatch system is Uber’s most critical component. When a rider requests a ride, the system must find the best available driver within seconds. “Best” is not simply “closest” — it factors in ETA, driver rating, trip direction, and supply balance.
How Matching Works
Rider Request Flow:

1. Rider opens app, taps "Request Ride"
   -> Request hits API gateway

2. Dispatch Service receives request
   -> Query: "Which drivers are available near (lat, lng)?"

3. Geospatial Index returns candidate drivers
   -> Typically 10-50 candidates within radius

4. Ranking Engine scores each candidate:
   - ETA to pickup (weight: highest)
   - Driver rating
   - Vehicle type match
   - Trip direction alignment (for pooled rides)
   - Supply balancing (avoid draining one area)

5. Top-ranked driver receives ride offer
   -> Driver has ~15 seconds to accept
   -> If declined, offer goes to next driver

6. Match confirmed
   -> Route calculated, ETA sent to rider
   -> Driver navigation begins
The entire flow from request to match confirmation typically completes in under 10 seconds. The geospatial query itself takes under 100 milliseconds.
Geospatial Indexing: The H3 Grid System
The core technical challenge in dispatch is answering “which drivers are near this location?” millions of times per second. Uber built H3, a hexagonal hierarchical spatial index, to solve this.
Why Hexagons
Traditional approaches use square grids (like dividing a map into tiles) or geohashes (which encode latitude/longitude into strings). Both have a fundamental problem: squares distort at higher latitudes, and neighbors in adjacent squares can be far apart while points within the same large square can be far apart too.
Hexagons solve this because every neighbor is equidistant from the center. A hexagonal cell has six neighbors, all at the same distance. This property is critical for radius queries — when you ask “find all drivers within 2 km,” you can simply check the target cell and its ring of neighbors rather than computing exact distances for every driver.
Square Grid vs Hexagonal Grid:

Square Grid:              Hexagonal Grid (H3):
+---+---+---+             __    __
|   |   |   |            /  \__/  \
+---+---+---+            \__/  \__/
|   | X |   |            /  \ X/  \
+---+---+---+            \__/  \__/
|   |   |   |            /  \__/  \
+---+---+---+            \__/  \__/

Corner neighbors in squares     All hex neighbors are
are farther than edge ones.     equidistant from center.
H3 Resolution Levels
H3 supports 16 resolution levels, from resolution 0 (each cell covers ~4.3 million sq km) to resolution 15 (each cell is about 0.9 sq meters). Uber typically uses resolution 7 (cells of about 5 sq km) for driver tracking and resolution 9 (cells of about 0.1 sq km) for fine-grained matching.
# H3 geospatial indexing (simplified)
import h3

def find_nearby_drivers(rider_lat, rider_lng, radius_km=2):
    # Convert rider location to H3 cell at resolution 9
    rider_cell = h3.latlng_to_cell(rider_lat, rider_lng, 9)

    # Get ring of neighboring cells (k=2 covers ~2km radius)
    search_cells = h3.grid_disk(rider_cell, 2)

    # Query driver index for all drivers in these cells
    candidates = []
    for cell in search_cells:
        drivers = driver_index.get(cell, [])
        candidates.extend(drivers)

    return candidates
Driver Location Updates
Every active driver’s app sends a GPS update roughly every 4 seconds. That is over 1 million location updates per second globally. Each update triggers:
- Convert new lat/lng to an H3 cell
- If the cell changed, remove driver from old cell, add to new cell
- Update the driver’s state in the real-time index
This index is held in memory (not in a traditional database) for speed. It is sharded geographically — the dispatch service for New York does not need to know about drivers in London.
Surge Pricing: Supply and Demand in Real-Time
Surge pricing (now called “upfront pricing” in many markets) adjusts ride prices based on local supply and demand. It is one of the most computationally interesting parts of Uber’s system.
How Surge Is Calculated
Surge Pricing Pipeline:

1. For each H3 cell (resolution 7, ~5 sq km):
   - Count available drivers (supply)
   - Count ride requests in last 2 minutes (demand)
   - Compute demand/supply ratio

2. If ratio exceeds threshold:
   - Apply surge multiplier (1.2x, 1.5x, 2.0x, etc.)
   - Multiplier follows a curve, not a step function

3. Smooth across neighboring cells:
   - Prevent sharp pricing boundaries
   - A rider standing on a cell border should not see
     wildly different prices by moving 10 meters

4. Apply time decay:
   - Surge decreases gradually as supply catches up
   - Prevents oscillation (surge attracts drivers,
     supply increases, surge drops, drivers leave, repeat)
The real-time computation runs on Apache Flink, processing the stream of ride requests and driver locations. Surge values update every 1-2 minutes per cell.
The Economics
Surge pricing is not just about revenue — it is a market-balancing mechanism. When prices rise in an area, three things happen: some riders delay their trip (reducing demand), drivers in nearby areas drive toward the surge zone (increasing supply), and the equilibrium restores itself. Uber published research showing that without surge pricing, the number of unfulfilled ride requests during peak times would increase by 25-30 percent.
ETA Prediction
When the app shows “your driver will arrive in 4 minutes,” that number comes from a sophisticated prediction system. It is not simply distance divided by speed.
The ETA Model
Uber’s ETA system combines:
- Graph-based routing — road networks modeled as weighted directed graphs. Edge weights represent travel time, not distance. One-way streets, turn restrictions, and highway on-ramps are all encoded.
- Historical travel times — for every road segment, Uber has years of actual trip data showing how long it takes to traverse at different times of day and days of week.
- Real-time traffic — GPS traces from active Uber drivers create a live traffic map. If 50 drivers on a highway segment are all moving at 15 km/h instead of the usual 60, the system adjusts ETAs for that segment.
- ML correction — a gradient-boosted decision tree model takes the routing engine’s estimate and adjusts it based on features like weather, local events, and pickup location complexity (airport terminals are harder than street corners).
ETA Prediction Pipeline:

1. Routing Engine (Dijkstra/A*)
   - Finds optimal path on road graph
   - Initial ETA based on segment travel times

2. Historical Adjustment
   - "This road segment at 5pm on Friday
     typically takes 2.3x the free-flow time"

3. Real-Time Traffic Overlay
   - Live GPS traces from Uber drivers
   - Update segment speeds every 30 seconds

4. ML Post-Processing
   - Features: time of day, weather, events, road type
   - Output: corrected ETA with confidence interval

Typical accuracy: within 2 minutes for 80%+ of trips
Data Pipeline: Processing 1M+ Events Per Second
Uber generates an enormous volume of event data: GPS pings, ride state changes, payment events, app interactions. The data infrastructure processes over 1 million events per second.
Architecture
Event Flow:

Producers (mobile apps, services)
    |
    v
Apache Kafka (message bus)
    |
    +---> Apache Flink (real-time processing)
    |         |-> Surge pricing computation
    |         |-> Fraud detection
    |         |-> Real-time analytics
    |
    +---> Apache Spark (batch processing)
    |         |-> ML model training
    |         |-> Historical analytics
    |
    +---> Apache Pinot (OLAP queries)
              |-> Dashboards
              |-> Ad-hoc queries
Apache Pinot deserves special mention. Uber adopted Pinot (and contributed significantly to its development) as a real-time OLAP datastore. It ingests data from Kafka with sub-second latency and supports SQL queries over trillions of rows. When an operations manager asks “how many rides started in downtown Manhattan in the last 15 minutes?”, Pinot returns the answer in under a second.
Data Storage
| Layer | Technology | Use Case |
|---|---|---|
| Transactional | MySQL (Schemaless) | Trip data, user data |
| Cache | Redis | Session data, feature flags |
| Object Store | S3 / HDFS | Raw event logs, ML datasets |
| Time-Series | M3 (custom) | Metrics and monitoring |
| OLAP | Apache Pinot | Real-time analytics |
| Graph | Custom (Uber’s road graph) | Routing and ETA |
Uber built “Schemaless,” a MySQL-backed document store that provides the flexibility of a document database with the operational maturity of MySQL. It uses MySQL as a storage engine but adds schema-on-read, secondary indexing, and automatic sharding.
Technology Stack Summary
Languages:    Go (core services), Java (data infrastructure),
              Python (ML, scripting)
Databases:    MySQL (Schemaless), Redis, Cassandra
Messaging:    Apache Kafka
Processing:   Apache Flink (real-time), Apache Spark (batch)
Analytics:    Apache Pinot (OLAP), M3 (metrics)
Geospatial:   H3 (hexagonal grid, open-sourced by Uber)
Routing:      Custom road graph + OSRM
Containers:   Kubernetes (migrated from Mesos)
Networking:   gRPC for inter-service communication
Key Takeaways
Uber’s architecture reveals several principles for building real-time, location-heavy systems:
- Model the physical world with the right data structure. H3’s hexagonal grid is not just clever — it eliminates an entire class of edge-case bugs that square grids create for distance calculations.
- Separate real-time from batch. Surge pricing needs sub-minute freshness. ML model training needs terabytes of historical data. These are different systems with different trade-offs.
- Language choice is an engineering decision, not a religious one. Uber chose Go for latency-sensitive services and Java for data-heavy systems. Each language plays to its strengths.
- Build for the speed of the business. Uber enters new cities in weeks. The architecture must support configuration-driven city launches, not code-per-city.
- Invest in custom infrastructure where it matters. H3, Schemaless, M3, and Peloton (Uber’s resource scheduler) exist because off-the-shelf tools did not meet their specific requirements.
Every ride you take involves a geospatial lookup across a hexagonal grid, a machine learning model predicting your arrival time, a real-time supply-demand calculation determining your price, and a data pipeline recording the entire journey — all completing within the few seconds between tapping “Request” and seeing your driver’s car appear on the map.
Related articles
- System Design System Design: Design a Collaborative Document Editor
Design a real-time collaborative editor like Google Docs. Covers conflict resolution with CRDTs and OT, presence awareness, cursor synchronization, and offline editing support.
- System Design System Design: Instagram Architecture Deep Dive
How Instagram scaled Django to 2B+ users. Covers feed generation, image processing pipelines, Stories architecture, and PostgreSQL sharding strategies.
- System Design System Design: Netflix Architecture Deep Dive
How Netflix evolved from DVD rental to a global streaming platform serving 250M+ subscribers. Covers microservices, Open Connect CDN, recommendations, and Chaos Engineering.
- System Design System Design: Spotify Architecture Deep Dive
How Spotify streams 100M+ songs to 600M+ users. Covers audio streaming, Discover Weekly ML, the squad/tribe model, event-driven architecture, and offline mode.