Debugging Strategies Every Developer Should Know
Master binary search debugging, rubber duck method, git bisect, stack traces, logging levels, and when to use print statements vs a debugger.
What you'll learn
- ✓A systematic approach to debugging instead of random guessing
- ✓Binary search debugging to isolate problems fast
- ✓How to actually read a stack trace
- ✓When to use print statements, a debugger, or git bisect
- ✓Logging levels and how to use them effectively
Prerequisites
- •Basic programming experience in any language
- •Familiarity with git (git workflows for context)
Every developer debugs. Few developers debug systematically. The difference between a junior and senior engineer often is not knowledge of the language — it is how quickly they can isolate a problem. Here are the strategies that make that gap smaller.
The Debugging Mindset
Before any technique, adopt the right mental model. Debugging is not about guessing — it is about forming hypotheses and eliminating them efficiently.
The scientific method for bugs:
- Observe the symptom. What exactly is wrong? What is the expected behavior?
- Reproduce the bug reliably. If you cannot reproduce it, you cannot verify a fix.
- Hypothesize where the problem might be.
- Test the hypothesis by narrowing scope.
- Fix the root cause, not the symptom.
- Verify the fix does not break anything else.
Skipping step 2 is the most common mistake. Developers jump to step 3 based on a vague bug report, change random things, and “fix” the wrong problem. Always reproduce first.
Binary Search Debugging
This is the most powerful general-purpose debugging technique, and too few developers use it explicitly.
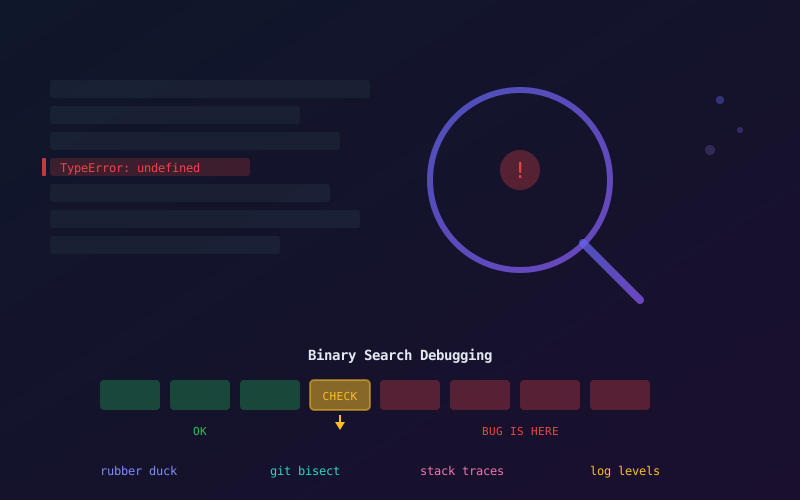
If your program produces wrong output and you have no idea where the bug is, find the midpoint of the code path and check whether the data is correct there.
- If correct at the midpoint: the bug is in the second half.
- If wrong at the midpoint: the bug is in the first half.
Repeat. You eliminate half the search space with each check, finding the bug in O(log n) steps instead of O(n).
def process_order(order):
    validated = validate(order)
    # CHECK 1: is 'validated' correct here?
    enriched = enrich(validated)
    # CHECK 2: is 'enriched' correct here?
    priced = calculate_price(enriched)
    # CHECK 3: is 'priced' correct here?
    result = save_to_db(priced)
    return result
Start at CHECK 2 (the middle). If enriched looks right, the bug is in calculate_price or save_to_db. One more check and you have found it.
This sounds obvious, but watch a struggling developer debug — they almost always start at the beginning and step through linearly. Binary search is faster.
The Rubber Duck Method
Explain the problem out loud, step by step, to an inanimate object (a rubber duck, a colleague, a wall). The act of verbalizing forces you to articulate your assumptions, and one of those assumptions is usually wrong.
This works because bugs often hide in the gap between what you think the code does and what it actually does. Explaining forces you to slow down and verify each step instead of skimming past it.
You do not need an actual duck. Writing the problem in a Slack message you never send works just as well. Many developers solve their own bug while typing the question for Stack Overflow.
Print Statements vs. Debugger
Both are valid. Use the right tool for the situation.
When to use print/console.log
- Quick checks: “Is this function even being called?”
- Loops: Print the value on each iteration to spot the wrong one
- Async code: Debuggers can be awkward with async; print statements show execution order clearly
- Remote environments: When you cannot attach a debugger
// Effective print debugging
console.log('[checkout] cart items:', JSON.stringify(items, null, 2));
console.log('[checkout] total before tax:', subtotal);
console.log('[checkout] tax rate:', taxRate, 'computed tax:', tax);
Tip: Prefix with a tag ([checkout]) so you can find and remove them later. Better yet, use a search pattern you can grep for:
console.log('DEBUG_CHECKOUT:', variable);
// Later: rg "DEBUG_CHECKOUT" to find and remove all of them
When to use a debugger
- Complex object state that is hard to print
- You need to inspect the call stack
- You want to modify variables mid-execution to test hypotheses
- Stepping through control flow you do not fully understand
// In Node.js
debugger; // Triggers a breakpoint when running with --inspect

// In VS Code: just click the gutter to set a breakpoint
My rule of thumb: Start with print statements. If you are still stuck after three rounds of adding prints, switch to a debugger.
Reading Stack Traces
Stack traces terrify beginners but they are the most useful debugging artifact you will ever get. Here is how to read them:
TypeError: Cannot read properties of undefined (reading 'map')
    at UserList (src/components/UserList.tsx:14:22)
    at renderWithHooks (node_modules/react-dom/...)
    at mountIndeterminateComponent (node_modules/react-dom/...)
    at beginWork (node_modules/react-dom/...)
Read from top to bottom:
- Line 1: The error type and message. This tells you what went wrong. Something was
undefinedwhen you tried to call.map()on it. - Line 2: The first frame with your code (not
node_modules). This tells you where it happened:UserList.tsx, line 14, column 22. - Remaining lines: The call stack leading to the error. Usually framework internals you can ignore.
The fix pattern: Go to UserList.tsx:14. Find what should be an array. Trace where it comes from. Add a null check or fix the data source:
// Before (crashes if users is undefined)
users.map(u => <User key={u.id} {...u} />)

// After
(users ?? []).map(u => <User key={u.id} {...u} />)
git bisect — Find Which Commit Broke It
When something worked last week but is broken now, git bisect does binary search through your commit history to find the exact commit that introduced the bug.
# Start bisecting
git bisect start

# Mark current commit as bad
git bisect bad

# Mark a known good commit (e.g., last week's release tag)
git bisect good v2.3.0

# Git checks out a commit in the middle. Test it.
# If it works:
git bisect good
# If it is broken:
git bisect bad

# Repeat. Git narrows down exponentially.
# After ~7 steps (for 128 commits), it finds the exact commit.

# When done:
git bisect reset
You can even automate it with a test script:
git bisect start HEAD v2.3.0
git bisect run npm test
# Git automatically runs the test at each step and finds the breaking commit
git bisect is criminally underused. It turns “something broke and we have 200 commits to look through” into a 2-minute process.
Logging Levels
For production debugging, structured logging beats print statements. Use logging levels correctly:
| Level | Use for | Example |
|---|---|---|
| ERROR | Something broke and needs attention | Failed to charge payment: card declined |
| WARN | Something unexpected but handled | Retry 2/3 for API call to /users |
| INFO | Normal but significant events | User 123 signed up, Deploy completed |
| DEBUG | Detailed diagnostic info | Cache miss for key user:123, SQL query took 45ms |
// Good: structured logging with context
logger.error('Payment failed', {
  userId: user.id,
  orderId: order.id,
  error: err.message,
  cardLast4: card.last4
});

// Bad: useless in production
logger.error('something went wrong');
Rules:
- ERROR and WARN are always on in production
- INFO is on by default, gives you a trail of what happened
- DEBUG is off in production, on in development
- Never log sensitive data (passwords, full credit card numbers, tokens)
A Debugging Checklist
When you are stuck, run through this list:
- Can you reproduce it? If not, gather more information before investigating.
- What changed? Check recent commits, deploys, config changes, dependency updates.
- What does the error message say? Read it carefully. Then read it again.
- Is it the code you think it is? Verify you are running the right version. Clear caches, rebuild, restart the server.
- Is the data what you expect? Inspect inputs, outputs, and intermediate state.
- Is it an environment issue? Does it happen locally? In staging? Only in production?
- Have you searched for the error? Paste the exact error message into your search engine. Someone has hit this before.
- Have you taken a break? The bug you have been staring at for an hour often becomes obvious after a 10-minute walk.
Debugging is a skill, not a talent. These strategies work because they replace randomness with structure. Practice them deliberately, and what used to take hours will start taking minutes.
Related articles
- Productivity Dotfiles Management: Sync Your Dev Setup Across Machines
Learn to manage dotfiles with GNU Stow, chezmoi, or a bare git repo. Bootstrap any new machine in minutes with your exact config.
- Productivity 10 Terminal Tools That Will 10x Your Productivity
Discover fzf, ripgrep, zoxide, bat, and more CLI tools that replace slow workflows with instant results. Install commands and config included.
- Productivity VS Code: Shortcuts and Habits That Actually Matter
The handful of VS Code shortcuts and habits worth learning — Command Palette, multi-cursor, fuzzy file and symbol search, the integrated terminal, source control, and settings worth changing.
- Git Finding Bugs with Git Bisect: A Practical Guide
Use git bisect to binary search through your commit history and pinpoint the exact commit that broke your code. Covers manual, automated, and advanced bisect workflows.